Introduction
I’ve noticed that as a result of working from home, my work schedule has gotten… Wonky. On one hand, my commute to the office is now thirty seconds rather than a half hour in each direction and is much simpler from a logistical perspective. On the other hand, the effacement of a physical barrier between my work and home life is such that I find myself multiplexing tasks from both throughout the day. I needed a way to keep track of how much time I actually spent working, and preferably one that required minimal manual effort.
My solution was to take a base of security monitoring, add a sprinkle of SQL programming, a soupcon of containerization, and tie it all together with a little python to bake up a nifty little layer cake of timesheet management à la geek. I’ll admit that it’s an unconventional use of these technologies, but I thought it would serve as a fresh perspective on what you can do with a little monitoring.
For more information on some of these topics, I’ve added a few links for your reading pleasure:
- https://blog.rapid7.com/2016/05/09/introduction-to-osquery-for-threat-detection-dfir/
- https://docs.splunk.com/Documentation/Forwarder/8.0.3/Forwarder/Configuretheuniversalforwarder
- https://docs.splunk.com/Documentation/Splunk/8.0.3/RESTUM/RESTusing#Authentication_and_authorization
To be able to mimic what I’m doing here, you’ll need the following:
- osquery
- Splunk universal forwarder
- A text editor
- Splunk Enterprise. A nice, easy way to set this up is to use their docker: https://hub.docker.com/r/splunk/splunk/
Do you absolutely need Splunk? No; if you want a quick summary you could use python and cron to parse the osquery results file instead. For my part, I like using Splunk to aggregate data. I’ll sometimes use the API to extract data so that I can analyze it in-depth with Jupyter, it can be rather practical.
Setting up your environment
Overview
So what does a setup like this look like? Here’s a simplistic diagram:
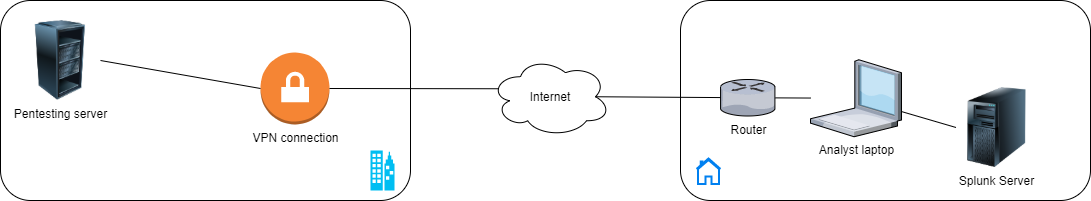
In this setup, there is a pentesting server that sits on a dedicated network at my employer. To work, I use my laptop to establish a VPN connection to the office. If I’m not connected to the VPN, I’m not working. When I break for lunch or stop working, I sever the connection to the VPN. So in this case, we can assume that VPN = working, no VPN = not working. This is not always the case, of course. Depending on your personal habits and how you want to track your time, you may need better indicators to discern when you are working and when you are not.
My analyst’s laptop currently sits on a network in my home. In the diagram, there is a Splunk server on that same network; in fact, this could be a container on my laptop or it could be an entirely separate device such as a NUC. One could argue that the Splunk server could sit on the company network instead, and that would make sense if you have a single server for your whole team. In this case, I’m working on the premise that the Splunk server is on the home network.
The analyst’s laptop has osquery running on it. Osquery is an open-source project created by Facebook; it allows you to “query your devices like a database” (I lifted this convenient snippet straight off their site at osquery.io, hence the quotes). A nifty benefit of osquery over sysmon is the ability to create rules: I can, for instance, set up a rule that collects information on how a process got called, whether it’s a process that exists in the filesystem or only in memory, etc. Could you do something similar directly in Splunk? Mostly. But I would contend that if you can simplify the collection and querying process by running some specific rules on end-user devices rather than on the server, you might make collection more straightforward and searching faster.
So in this case, I’m running osquery on my laptop and I am leveraging Splunk’s Universal Forwarder to forward Windows events and osquery events to the Splunk server. Of course, if you’re running the Splunk server as a container on your laptop and are willing to set up a volume for it, you could dispense with the Universal Forwarder and have the server index your osquery logs as if they were local files. But in this case, I liked the idea of using the Universal Forwarder - so in this blog post, I go over setting it up.
Finally, on my laptop I have scripts that query the Splunk server. When I first set this up (admittedly late at night), I had assumed that my rules would trigger log entries every ten minutes and that I could easily derive the number of minutes I spent working by multiplying the number of entries per day by 10 - but this isn’t how osquery works! Instead, you get an entry indicating when your rule is triggered (added) and when it is no longer triggered (removed). Although you can still do this with a single Splunk query, I feel there’s more flexibility when using a Python script. Up to you to decide which you prefer.
On your server
- Install docker
- Pull the Splunk docker image:
docker pull splunk/splunk:latest - Run a Splunk container:
docker run --name splunk -it splunk/splunk -p 0.0.0.0:8000:8000 -p 0.0.0.0:8089:8089 -p 0.0.0.0:9997:9997. This assumes that you want to expose the web interface but also the API interface for any further manipulation via REST requests. I use this feature in this blog post, but if you’re going to only use the web interface for your queries, you don’t necessarily need port 8089. And if you’re collecting osquery data from your local machine, you needn’t bother with port 9997.
On your workstation
- Install osquery. You can leave all the defaults.
- Install Splunk Universal Forwarder. This will walk you through creating an account. This should go without saying, but do keep a record of the credentials, and pick a secure password.
pwgenis your friend here. Also, during the installation you’ll be asked if you want to set up your Splunk server, do specify your server details here. Do remember that when you specify the server details, these are the details of your logging server, not your deployment server. Leave the deployment server information blank - at least, that’s the case for this blog post. - Configure osquery by opening up
osquery.conf, locating thepackssection and modifying it as follows:
[...]
  "packs": {
    [...]
    "windows-hardening": "C:\\Program Files\\osquery\\packs\\windows-hardening.conf",
    "windows-attacks": "C:\\Program Files\\osquery\\packs\\windows-attacks.conf",
    "heapspray-rules": "C:\\Program Files\\osquery\\packs\\heapspray-rules.conf" <--- Added my own file here.
  },
[...]
- In that new
heapspray-rules.conffile, you can now define your rules; if you’re familiar with JSON, this should be pretty straightforward to read. I’ve set up two examples here:
{
  "platform": "windows",
  "queries": {
    "VPN_connection": {
      "query" : "select * from process_open_sockets where pid in (select pid from processes where name like 'openvpn.exe') and remote_port = 1194;",
      "interval" : "600",
      "version": "0.0.1",
      "description" : "Checks to see if there are active connections via OpenVPN"
    },
    "Tetris":{
      "query" : "select * from processes where name='tetris.exe';",
      "interval" : "600",
      "version" : "0.0.1",
      "description" : "Is tetris running? Helps keeps tabs on how much I'm playing :-P."
    }
  }
}
True to its name, the query parameter is what retrieves the information from osquery and dumps the results into osqueryd.results.log.
My first example, VPN connection, will trigger if my OpenVPN client has an active connection. This is because OpenVPN is a service that I might leave running constantly; therefore, I should only see entries when it’s actively being used.
My second example, Tetris, triggers if at any point in the polling process osquery sees tetris.exe is running. I don’t leave Tetris running in the background while I’m working, so there’s no reason to check for anything else.
Note that these queries run every ten minutes; if you want them to run more or less often, adjust the interval parameter.
- Now that these rules are configured, restart your osquery service. Make sure that the service doesn’t stop, and that there are no errors related to your new rules in your
logdirectory. - You will also need to add the osquery results file to the list of files to monitor with your Splunk forwarder. You can do this from the Splunk forwarder directory by running:
.\splunk.exe add monitor -source 'C:\Program Files\osquery\log\osqueryd.results.log'
Running queries
At this point, we’ve set up a splunk server to receive log information, and then configured our workstation to forward osquery information to that splunk server instance. All we have left to do is to query our splunk instance. Here is a base query that works nicely:
host="YOURHOST" sourcetype="osqueryd.results*" name=pack_heapspray-rules_VPN_connection
This will extract any osquery results from your workstation and filter them by the name of the query you defined in your heapspray-rules pack, which in turn was defined as being used in the osquery.conf file.
Note that these results are fairly verbose; this query can be useful for the timeline to get a general idea of when you were working. I mentioned earlier that you can aggregate the information with a single query. Here it is:
host="YOURHOST" sourcetype="osqueryd.results*" name="pack_heapspray-rules_VPN_connection" AND action=added |
    rename calendarTime as startTime |
    join columns.pid [
        search host="YOURHOST" sourcetype="osqueryd.results*" name="pack_heapspray-rules_VPN_connection" AND action=removed |
        rename calendarTime as endTime] |
    eval startDateTime = strptime(startTime, "%a %B %d %H:%M:%S.%N %y") |
    eval endDateTime = strptime(endTime, "%a %B %d %H:%M:%S.%N %y") |
    eval timeSpent = tostring((endDateTime - startDateTime), "duration")|
    table startTime, endTime, timeSpent
This is a complex query that merits some breaking down. In a nutshell:
- We first look for VPN events that were added and we rename the calendarTime field to
startTime. - Then we look for VPN events that were removed and rename the calendarTime field to
endTime. - Next, we join the two events using
columns.pidas the join field. This merges the two sets of data into one. - After this, we have to convert
startTimeandendTimeinto epoch so that we can compute the time differences between the two. We usestrptimeto do this. - Now, we can compute
timeSpentas the difference betweenstartTimeandendTime. - Finally, we create a table with the start time, the end time, and the difference between the two.
Extending your functionality
Being able to query your Splunk instance for information on your work habits is practical to get an appreciation for how much you work day-to-day. But perhaps you want to take it a step further and do more processing via a script, perhaps even generate invoices from this data. Given that Splunk has a REST API that is easy to query, you could pull the data in with relative ease using standard python libraries:
from bs4 import BeautifulSoup
import json
import requests
from time import sleep
from termcolor import colored
import warnings

warnings.simplefilter("ignore")

base_url = "https://SPLUNKHOST:8089"
auth_url = base_url + "/services/auth/login"
username = "SOME_POWER_USER"
password = "SOME_PASSWORD"

# Set up your session
response = requests.post(auth_url,
                         data={"username": username, "password":password},
                         headers = {"username":username, "password": password},
                         verify = False)
soup = BeautifulSoup(response.text)
session_key = soup.sessionkey.text

# Perform your search:
search_url = base_url + "/services/search/jobs"
response = requests.post(search_url,
                         data = {"search": """search host="YOURHOST" sourcetype="osqueryd.results*" name=pack_heapspray-rules_VPN_connection""",
                                "output_mode": "json"},
                         headers = {"Authorization": "Splunk {}".format(session_key)},
                         verify = False)
search_id = response.json()["sid"]
search_status_url = base_url + "/services/search/jobs/{}/results/?output_mode=json".format(search_id)
no_results = True
while no_results:
    sleep(10)
    response = requests.get(search_status_url,
                            headers = {"Authorization": "Splunk {}".format(session_key)},
                            verify = False)
    if(response.status_code == 200):
        json_response = response.json()
        no_results = False
# Parse your results as JSON. At this point you can use them any way you see fit:
for result in json_response["results"]:
    json_result = json.loads(result["_raw"])
    print(json_result["name"], json_result["calendarTime"])
This was a fun and refreshing use of a few defensive security skills to help curb my (over)work from home habits. Of course, this little project is heavily overengineered. We could have gotten away with a little python and osquery! But it’s quirky little adventures like these that help me stay abreast of new technologies in the security industry. If you haven’t had the chance to play around with these tools, I recommend you give this a whirl.